Track your QR code performance with real-time analytics. See who scans, when, where, and on what device.
Click Scans on QR Code Card
From your dashboard, find the QR code you want to track and click the "Scans" count on the card. This opens the analytics view.
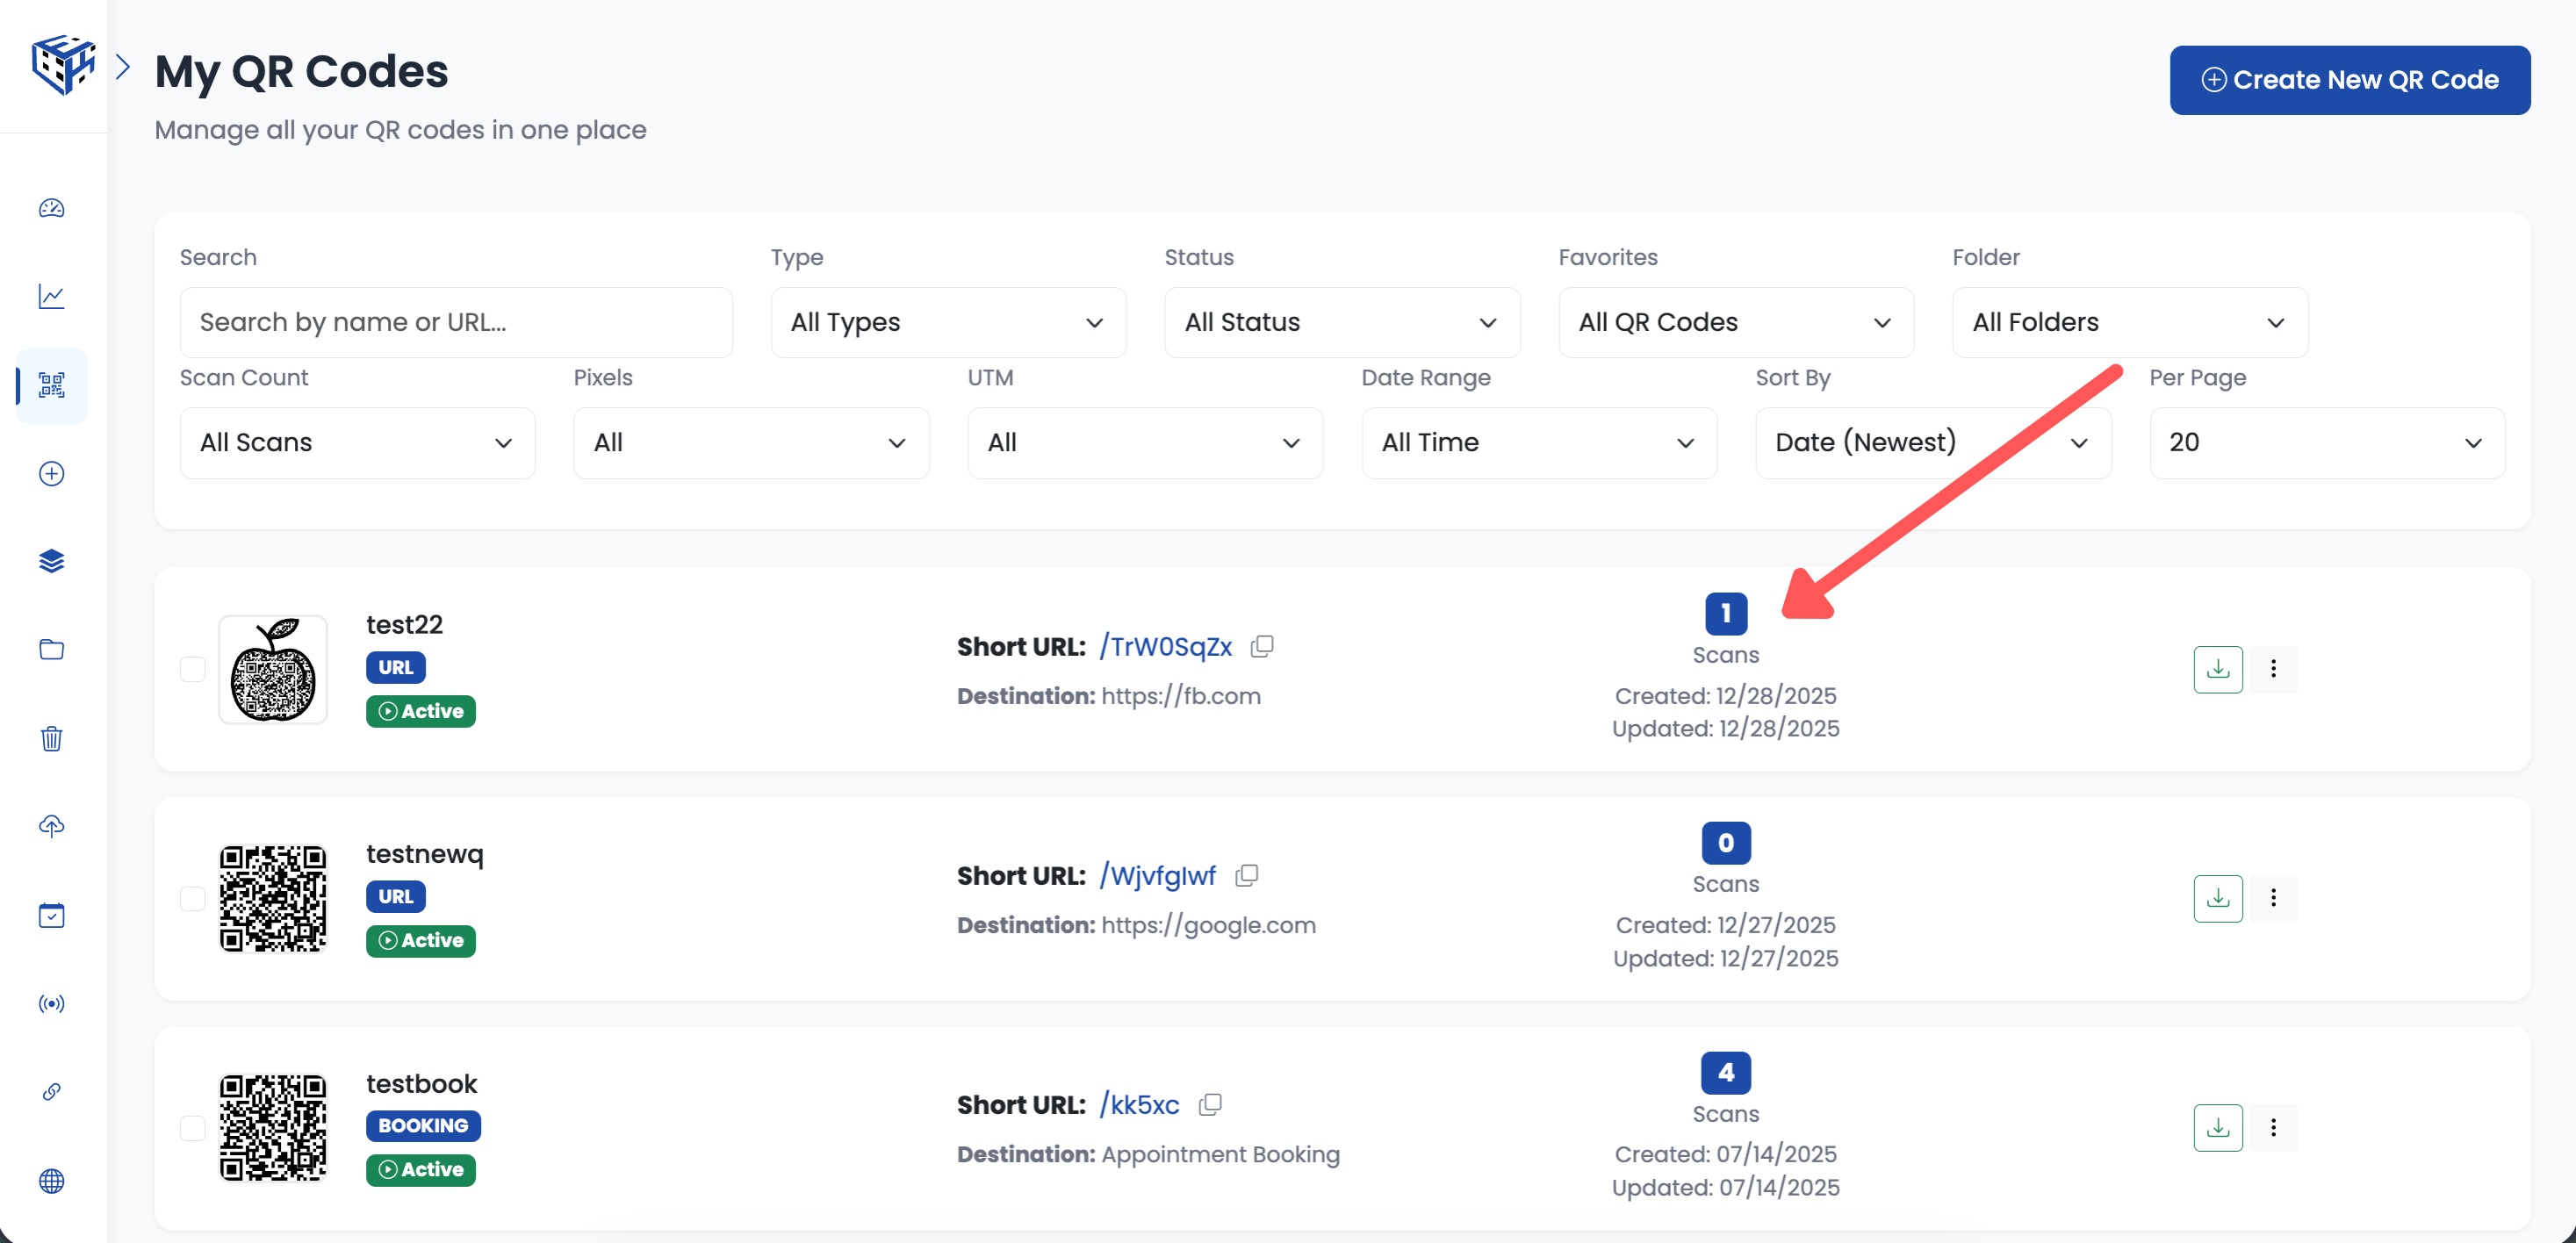
Click the Scans count to view analytics
Overview Stats
At the top of the analytics page, you'll see key metrics at a glance:
| Metric | Description |
|---|---|
| QR Code Preview | Your QR code image with name and status (Active/Paused) |
| Total Scans | All scans since QR code creation |
| Unique Visitors | Unique users (excludes repeat scans from same device) |
| Created Date | When the QR code was created |
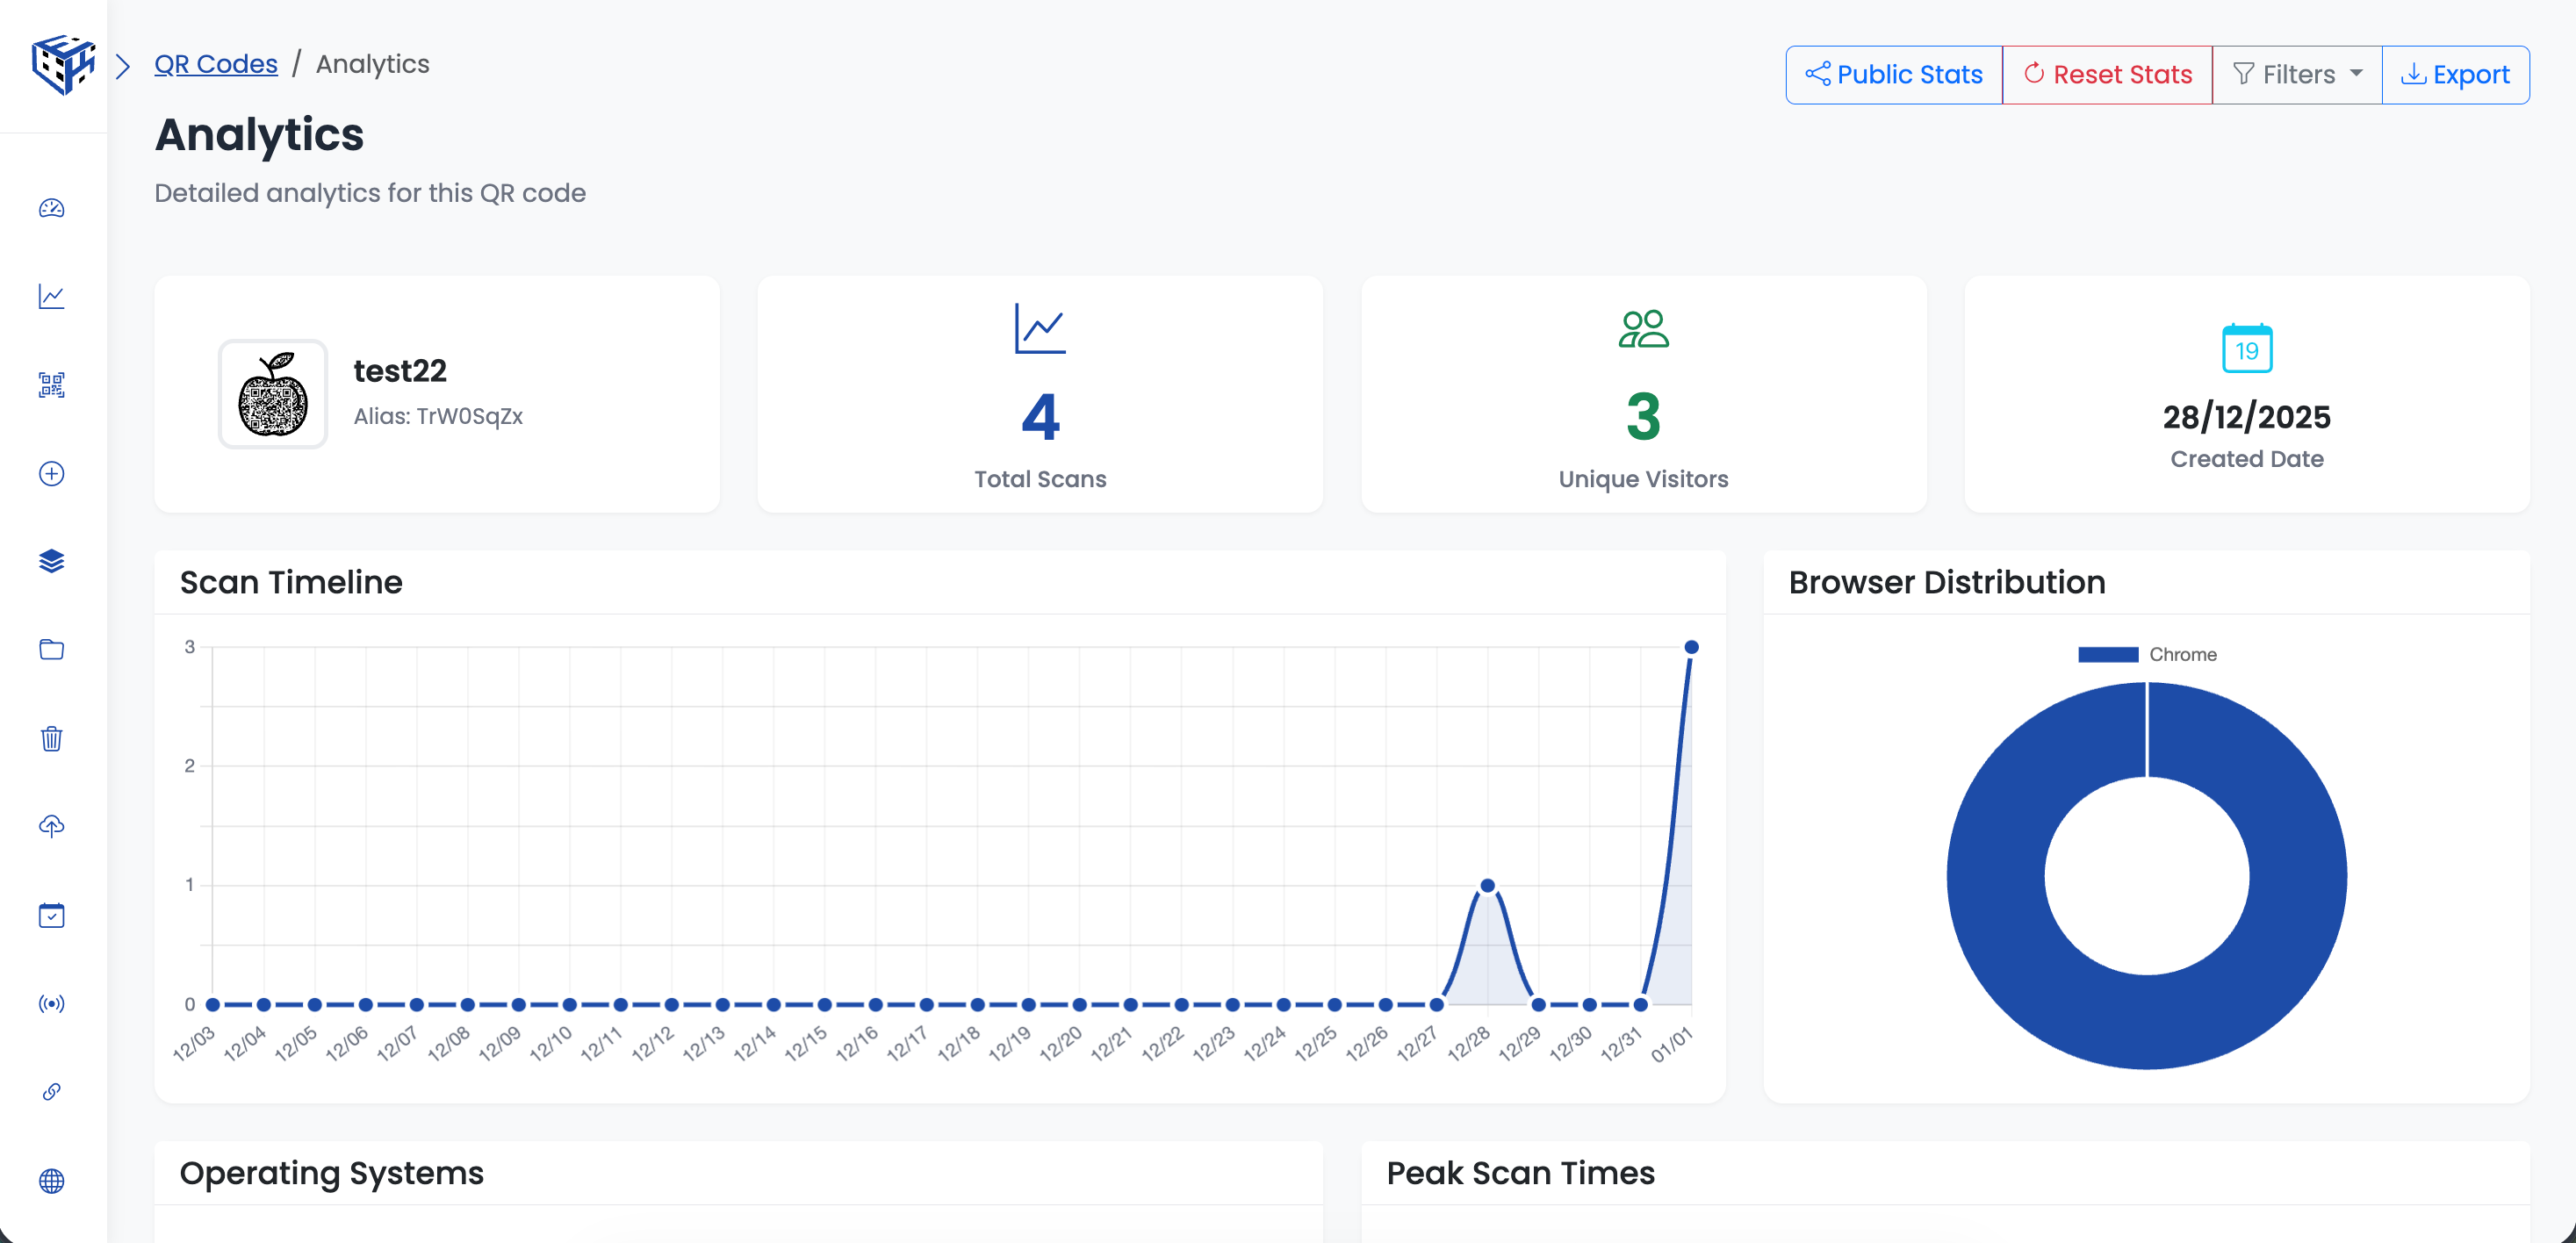
View key metrics at a glance
Charts & Visualizations
Visual charts help you understand your QR code performance:
- Scan Timeline - Daily scan trends over time
- Browser Distribution - Chrome, Safari, Firefox, Edge breakdown
- Operating Systems - Windows, Mac, iOS, Android distribution
- Peak Scan Times - Busiest hours for scans
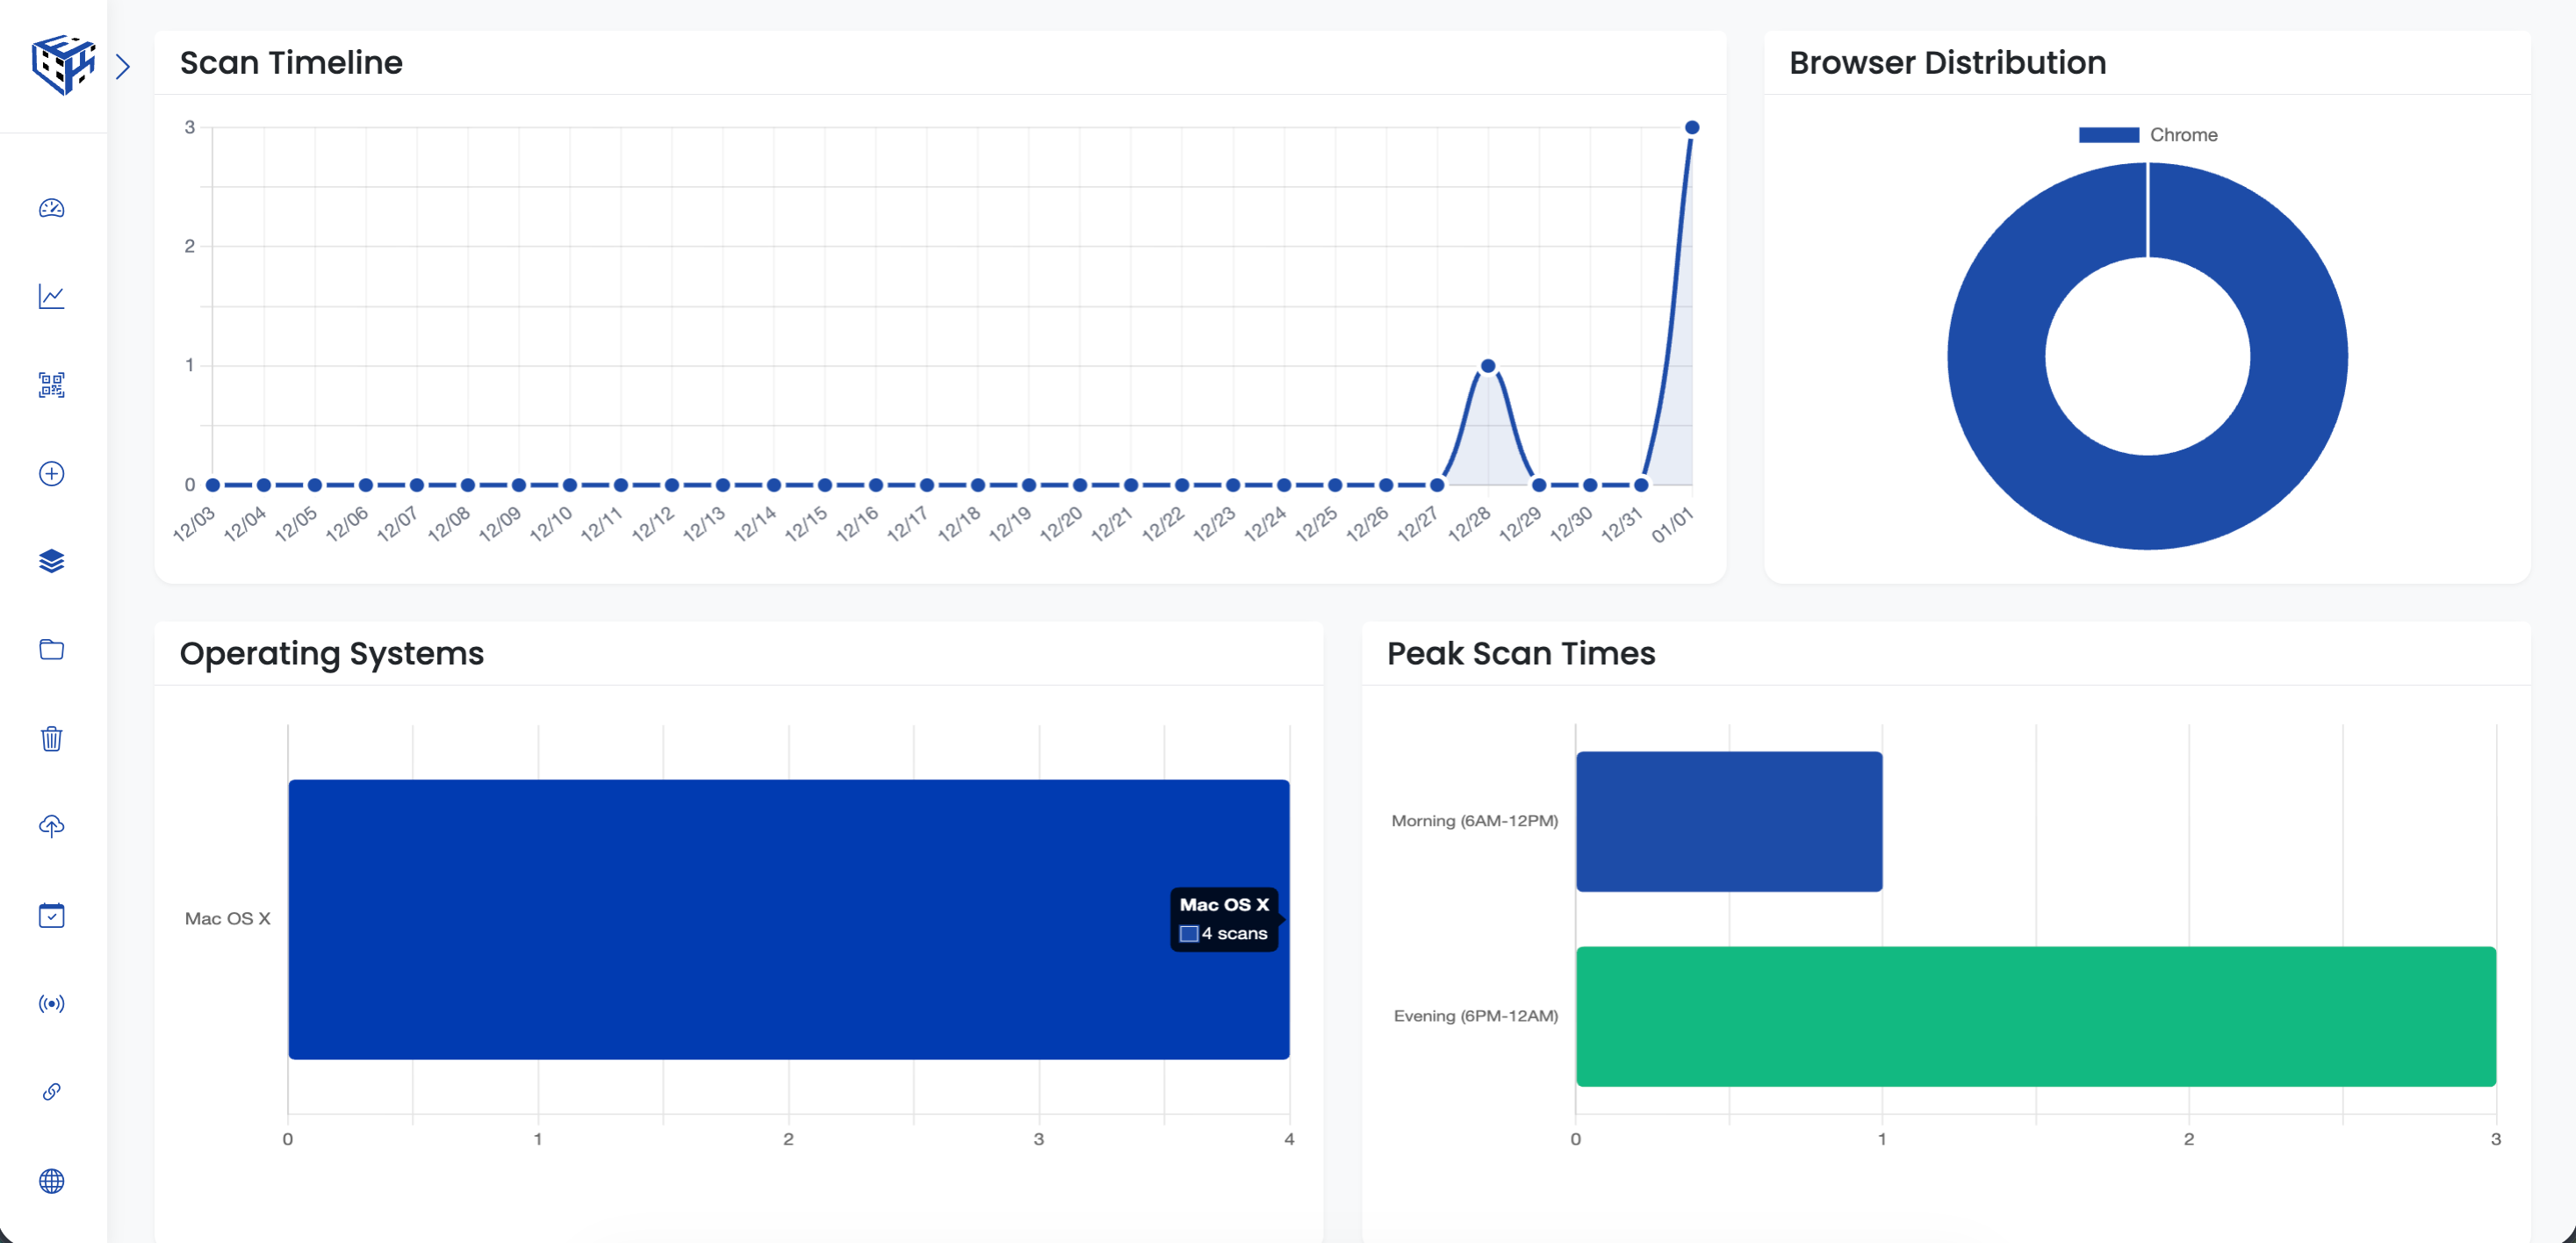
Visualize your scan data with charts
Geographic Distribution
See where your scans are coming from with the geographic table:
- Country with flag icon
- City breakdown within each country
- Activity bar showing relative scan volume
- Total scan count per location
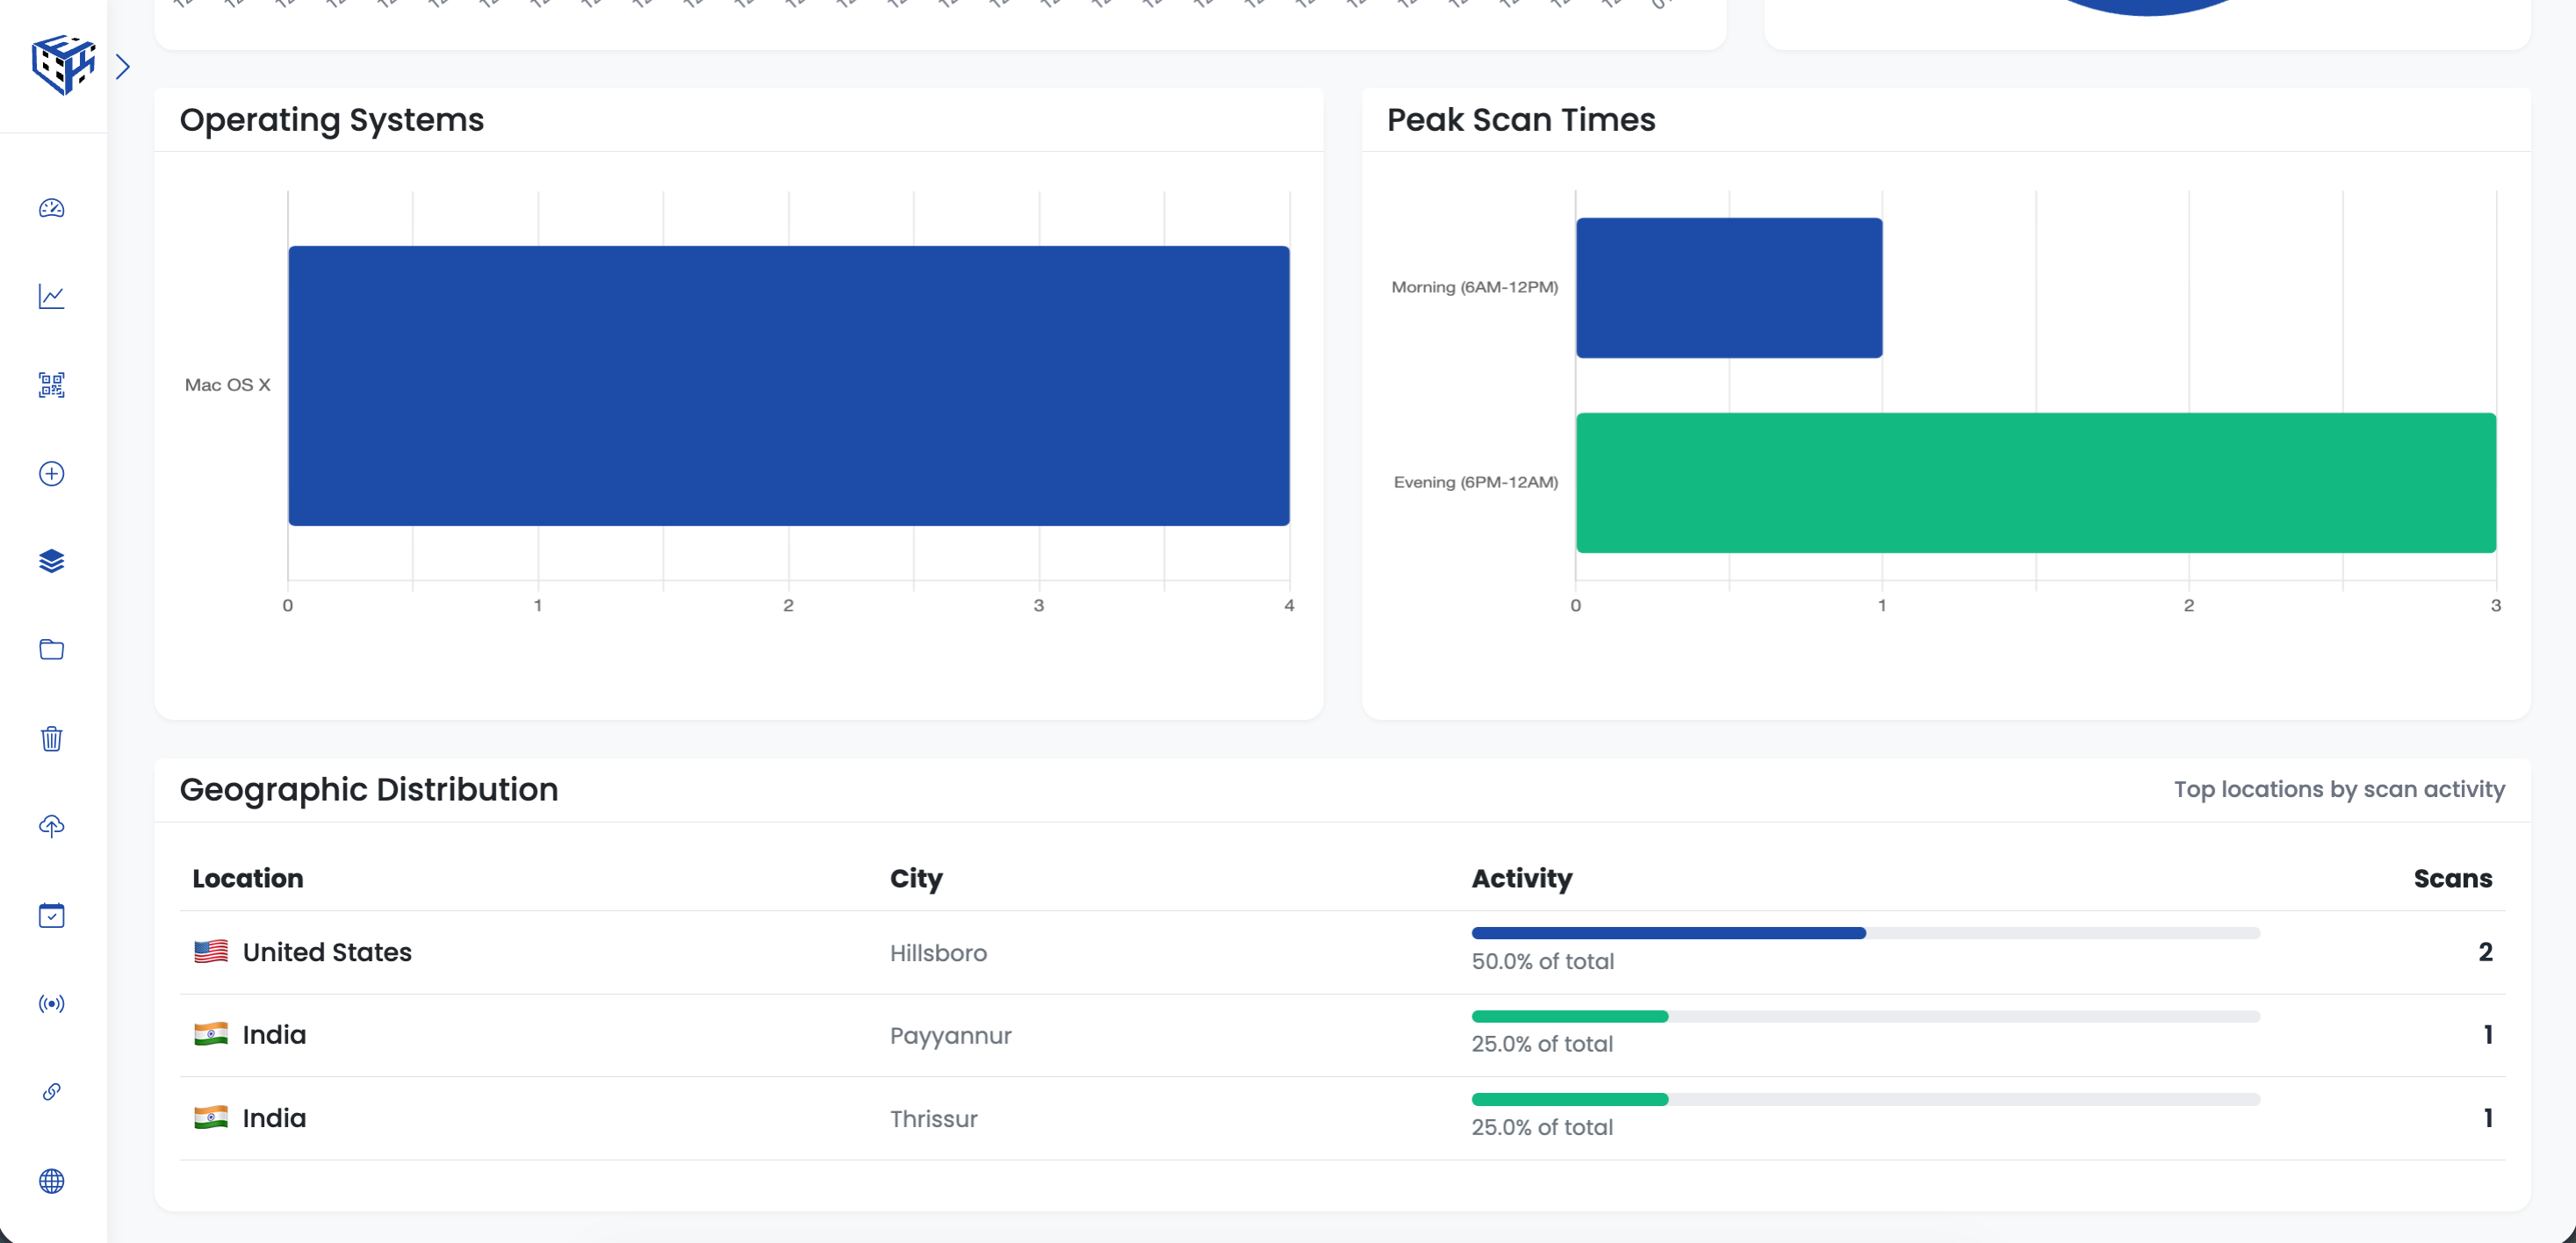
See where your scans are coming from
Detailed Scan History
View every individual scan with complete details:
| Column | Description |
|---|---|
| Time | Exact date and time of the scan |
| Location | Country and city of the scanner |
| Device | Mobile, Desktop, or Tablet |
| Browser | Chrome, Safari, Firefox, etc. |
| OS | Operating system (iOS, Android, Windows, Mac) |
| Language | Browser language setting |
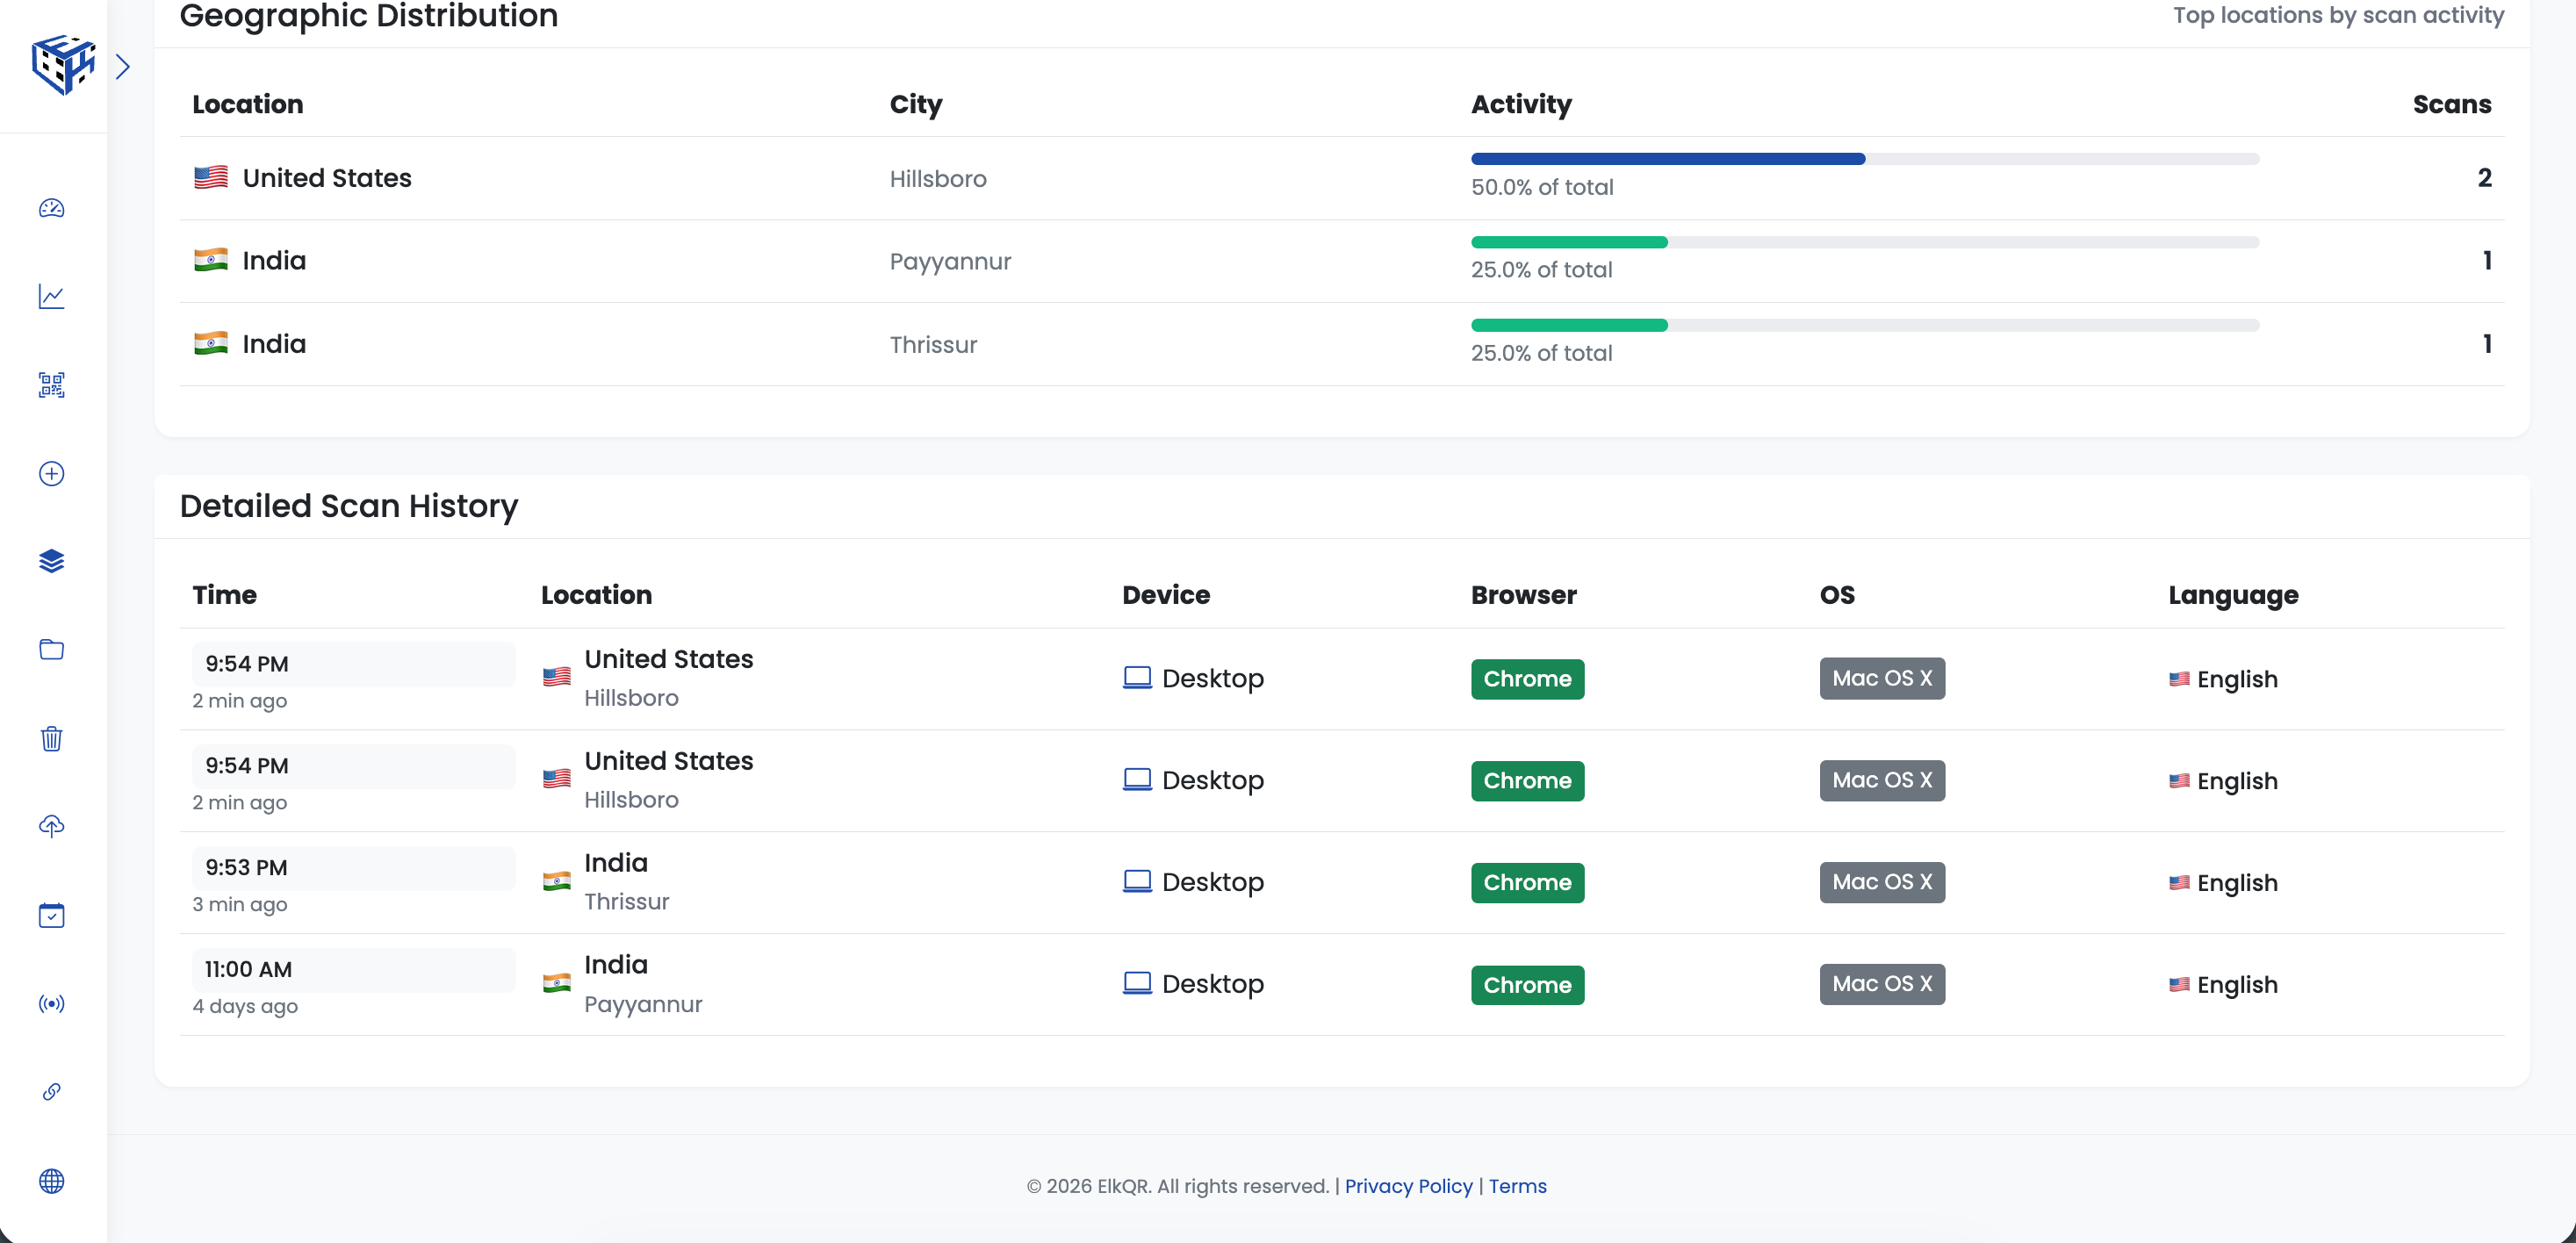
View every scan with full details
Filter Your Data
Use the Filters dropdown to narrow down your analytics:
- Date Range - Last 7 days, 30 days, 90 days, 1 year, or custom
- Device Type - Mobile, Desktop, or Tablet
- Browser - Chrome, Safari, Firefox, Edge
- Country - Filter by specific country
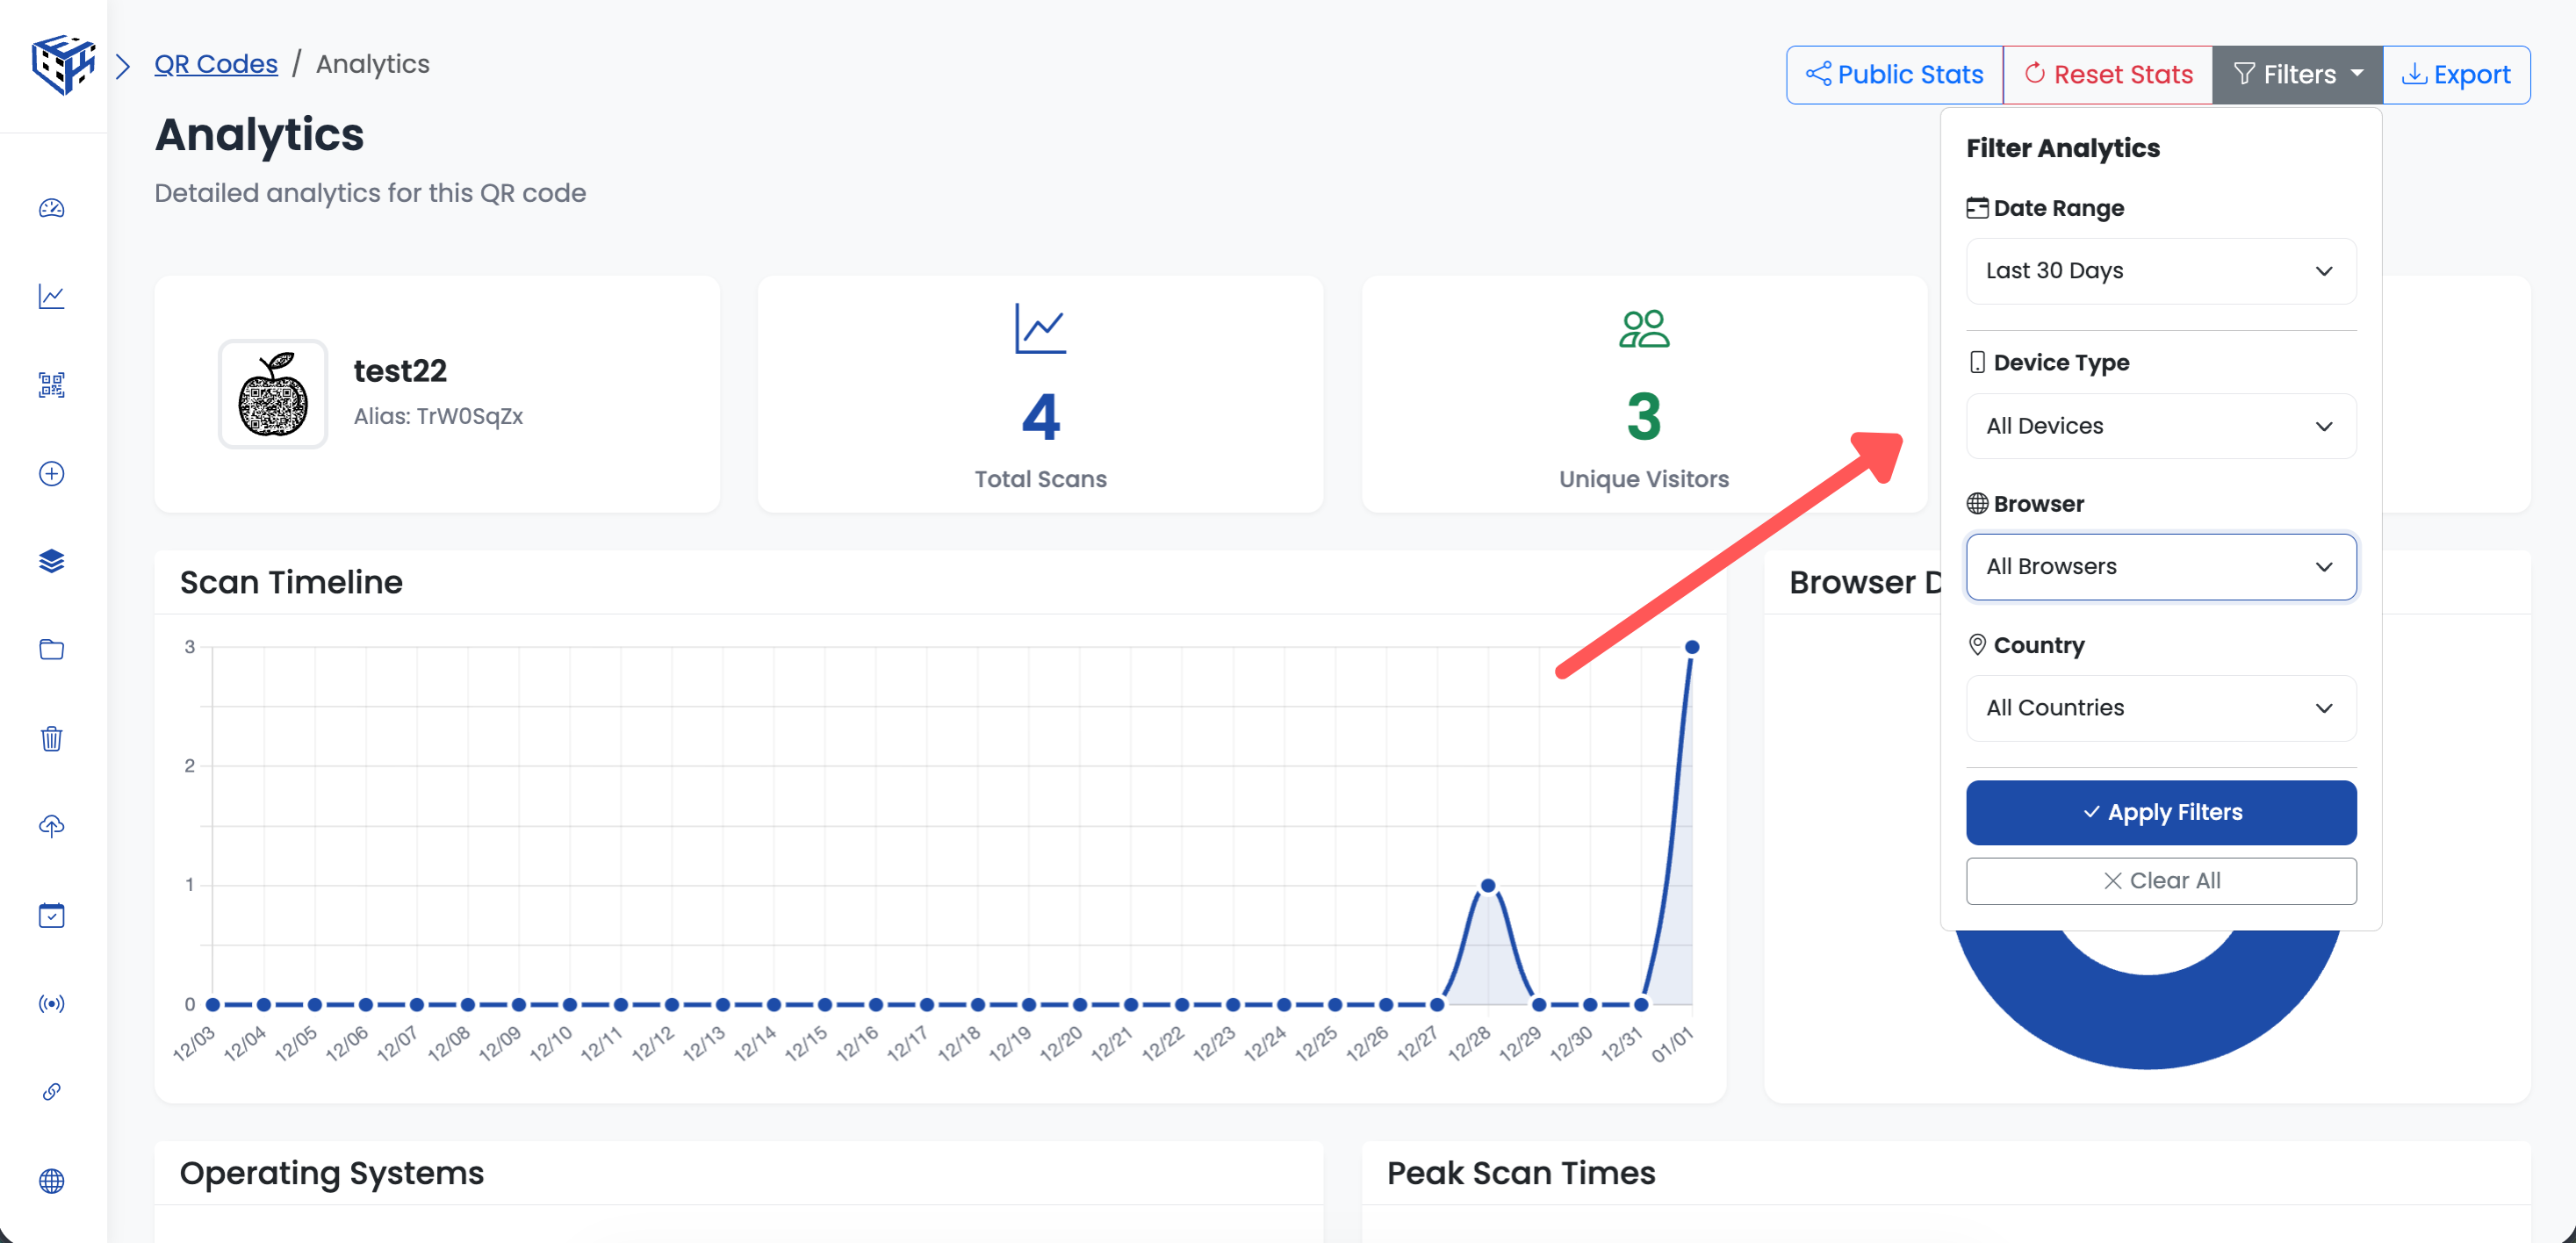
Use filters to narrow down your analytics
Export Data
Click the Export button to download your analytics data for further analysis or reporting.
- Scan Analytics & Tracking - Feature overview and tracked data
- How to share QR code stats (Public Stats) - Share analytics with others
Still facing difficulties?
Click here to contact our support team for assistance